
Logging and tracking your workouts—especially weights and sets—and viewing them in graph form has some real, practical benefits that go beyond just “writing things down.”
First, it makes progress visible. When you see your lifts plotted over time, you can clearly tell if you’re getting stronger, staying consistent, or hitting plateaus. This removes guesswork and shows whether your training is actually working.
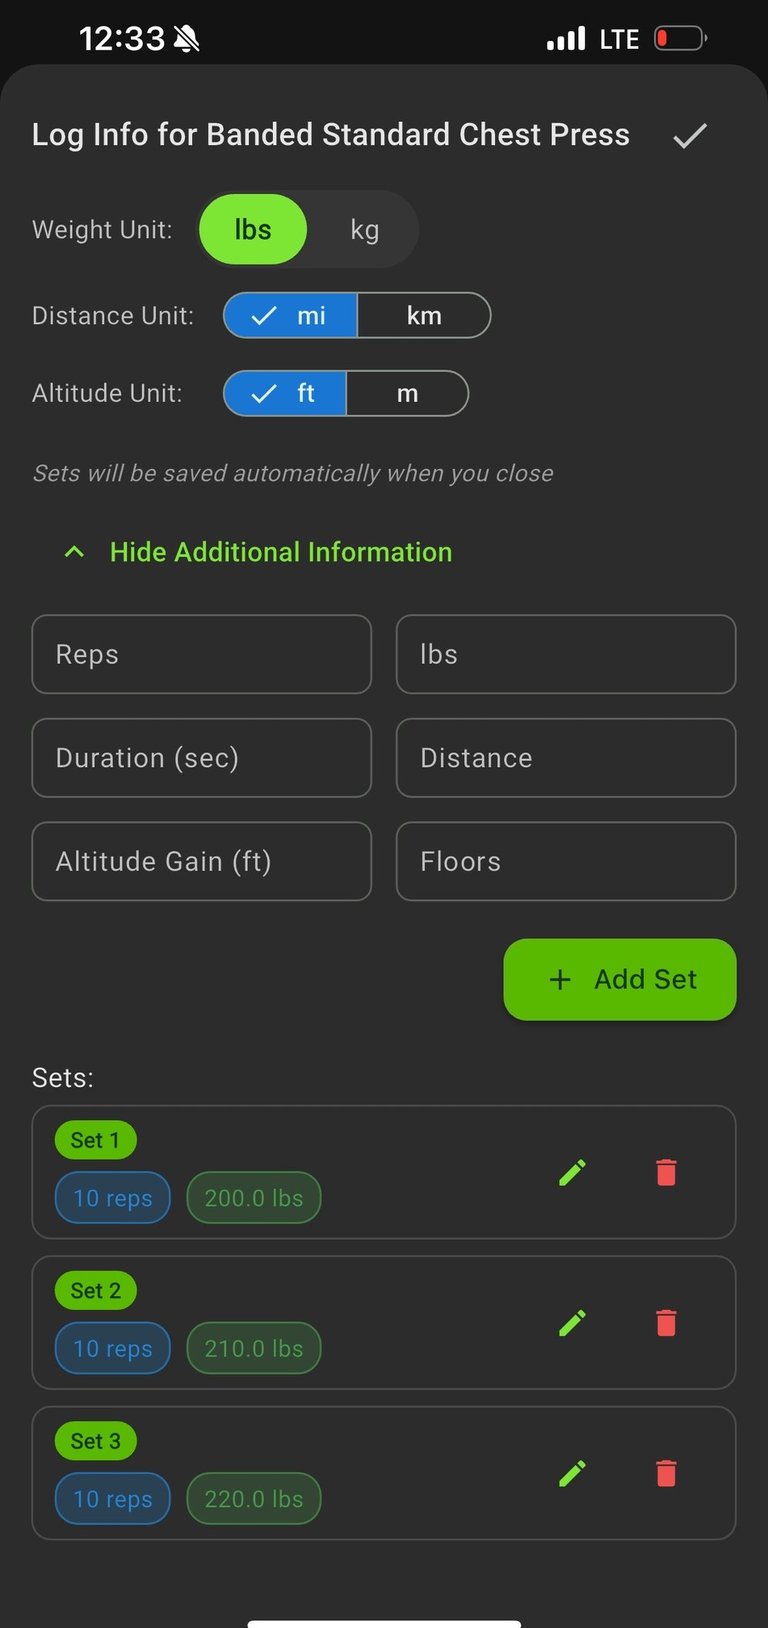
Second, it helps with progressive overload, which is key for strength and muscle growth. Tracking weights and sets lets you intentionally increase load, volume, or intensity instead of relying on memory. Graphs make it easy to spot when it’s time to push harder or when you need to back off.
Third, it boosts motivation and accountability. Seeing upward trends in a graph is rewarding and reinforces consistency. Even small improvements feel meaningful when you can visually track them over weeks or months.
Fourth, it supports smarter training decisions. Patterns in graphs can reveal overtraining, stagnation, or recovery issues. If performance drops or stalls, the data helps you adjust rest, volume, or exercise selection before burnout or injury happens.
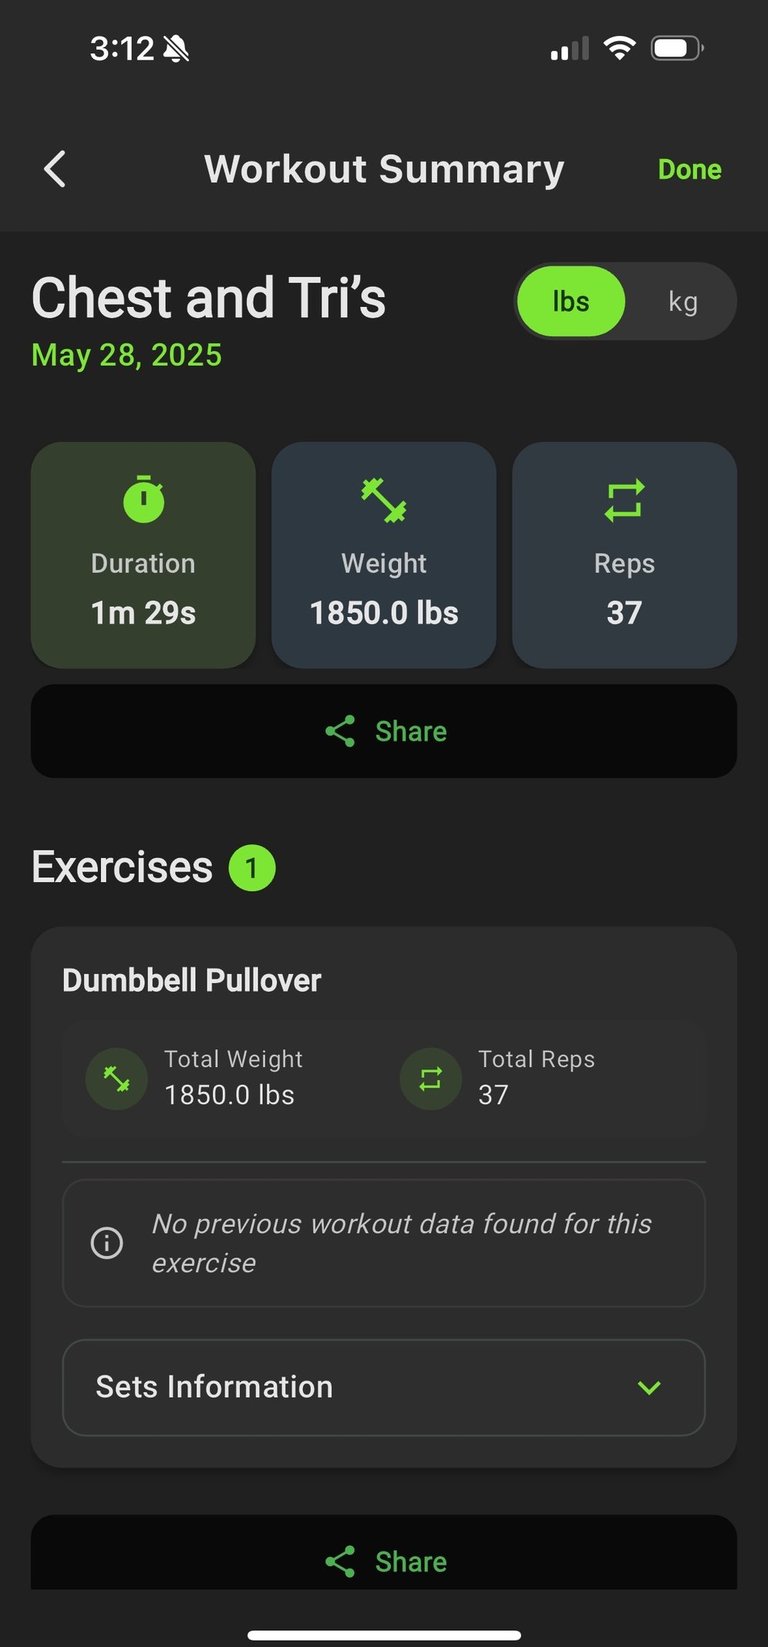
Finally, it creates a long-term training record. Over time, your graphs become a personalized fitness history, helping you set realistic goals and return to previous strength levels after breaks or injuries.
Overall, logging and graphing workouts turns training from guesswork into a data-driven process that leads to better results, consistency, and confidence in your progress.